Banking Industry Analysis
![]()
Background
In recent months, I have been experimenting with different valuation methods to value a variety of companies. In my finance class, I learned Discounted Cash Flow Valuation with the traditional Capital Asset Pricing Model (CAPM) and a little bit of Dividend Discount Model here and there. Then, I started to use them to value actual companies to practice my skillsets. It has been going well until I couldn’t use the DCF model to value banks.
I quickly learned Comparable Company Analysis to see if it works for intrinsic valuation. More on that later. Then, I researched how to value banks on the internet, and I learned to use Net Tangible Asset or Book Value as a basis of the valuation instead of Free Cash Flow to find intrinsic values.
So, in this project, we will do two tasks:
Disclaimer: It is not intended to be investment advice. Seek a duly licensed professional for investment advice.
Comparable Company Analysis
Comparable Company Analysis is a helpful tool if an investor wants to determine if a company is undervalued or overvalued based on its industry peers. However, an investment decision based solely on comps is not a good decision because the temporary market conditions and non-fundamental factors can influence the implied share price.
Depending on the companies selected, the implied share price may also be inaccurate. For example, I based the comps on the top banks in the United States, earning between 30 billion dollars and 130 billion dollars of revenues. Depending on the range of revenues, the accuracy may be different. However, comps are an excellent way to determine a benchmark value for multiples used in valuation.
Download File: Comparable Company Analysis Spreadsheet
Step 1: Capitalization
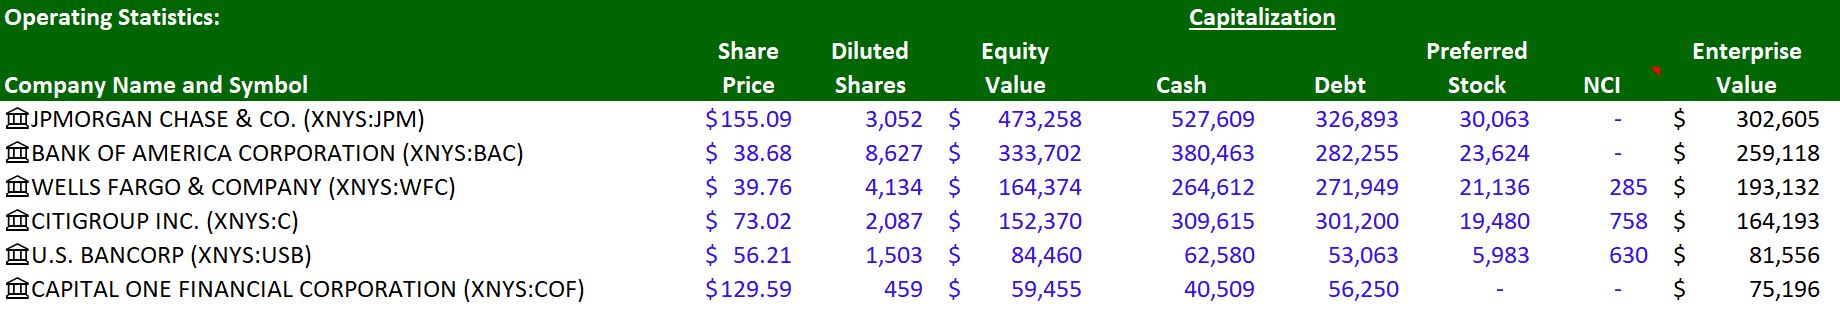 |
Capitalization Formulas:
- Equity Value = Share Price x Shares Outstanding
- Enterprise Value = Equity Value + Debt + Preferred Stock + Non-controlling Interest - Cash and Cash Equivalents
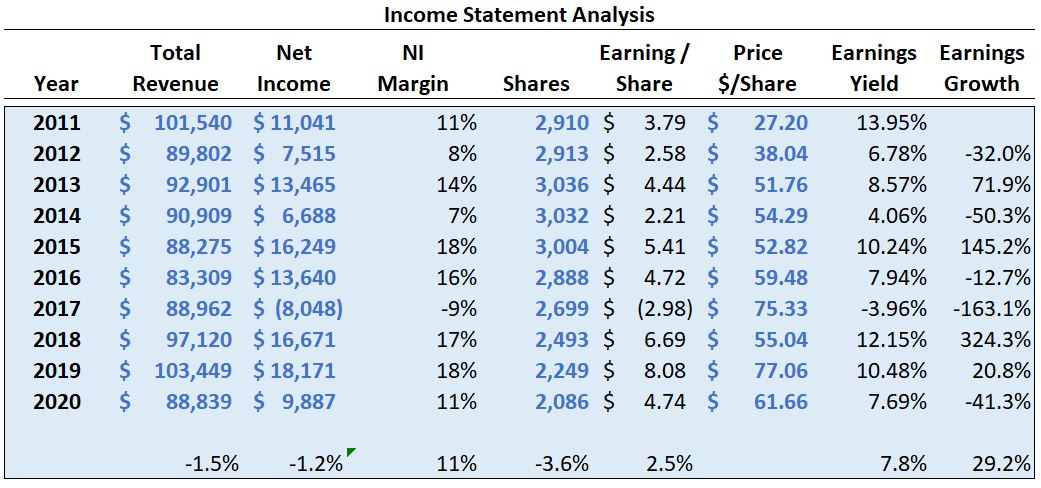
Step 2: Revenues, Earnings Before Taxes, and Net Incomes
 |
The spreadsheet also shows that you can do comps forecast for the following year. Since I finished the individual company analysis first, I used the rates already calculated to forecast revenues, EBTs, and net incomes. Some companies may see an overblown growth due to recovery from Covid-19.
Percent Change Formulas:
- New Value / Old Value - 1
- New Value - Old Value / ABS(Old Value)
The first one is a quick percent change formula, but it is not accurate when the old value is negative. In that case, use the second formula.
EBT Margin Formula:
- EBT Margin = EBT / Revenue
The reason to use EBT instead of EBITDA is that banks are not as capital intensive as other retail companies. Depreciation and amortization do not have much impact, and EBT still provides an approximate snapshot of a bank’s cash flow. Also, EBITDA is not readily available in their financial statement, unlike EBT.
Step 3: Multiples and Medians
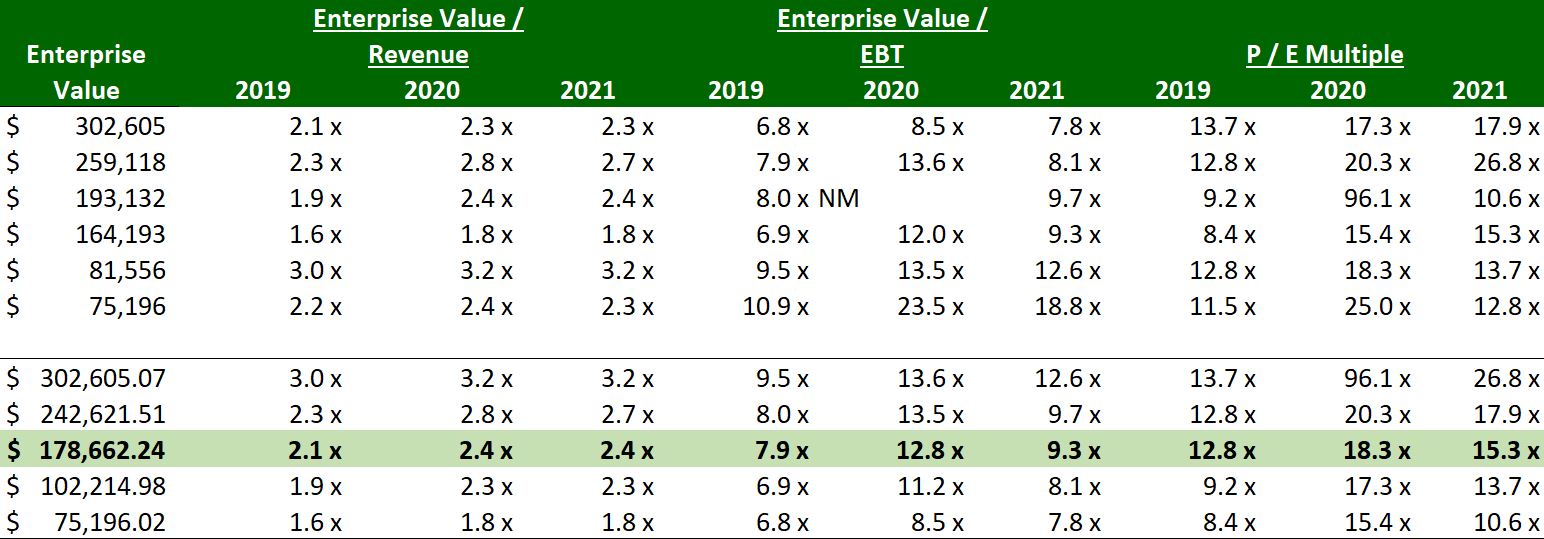 |
Formulas:
- EV/Revenue Multiple = Enterprise Value / Revenue
- EV/EBT Multiple = Enterprise Value / EBT
- P/E Multiple = Equity Value / Net Income
Next, I calculated minimum, 25th percentile, median, 75th percentile, and maximum to find a range of implied share prices for the industry comps multiple.
Step 4: Implied Share Price
 |
Multiply the bank’s revenue, EBT, or net income with its respective industry comps multiple to find the implied Enterprise Value. Then, subtract net debt from the implied enterprise value to get the implied equity value. Divide the implied equity value by shares outstanding to get the implied share price. In the end, you can judge the value of the stock by calculating the premium/discount.
Formulas:
- Net Debt = Total Debt - Cash
- Implied Share Price = (Implied Enterprise Value - Net Debt) / Shares Outstanding
Individual Company Analysis
Comparables are fun! But I still need to do a comprehensive analysis of each company to arrive at my investment decision confidently. First, I want to give credit where credit’s due. I learned this from Cameron Stewart, CFA. He has excellent videos on valuation, and I highly recommend it if you are interested in valuation.
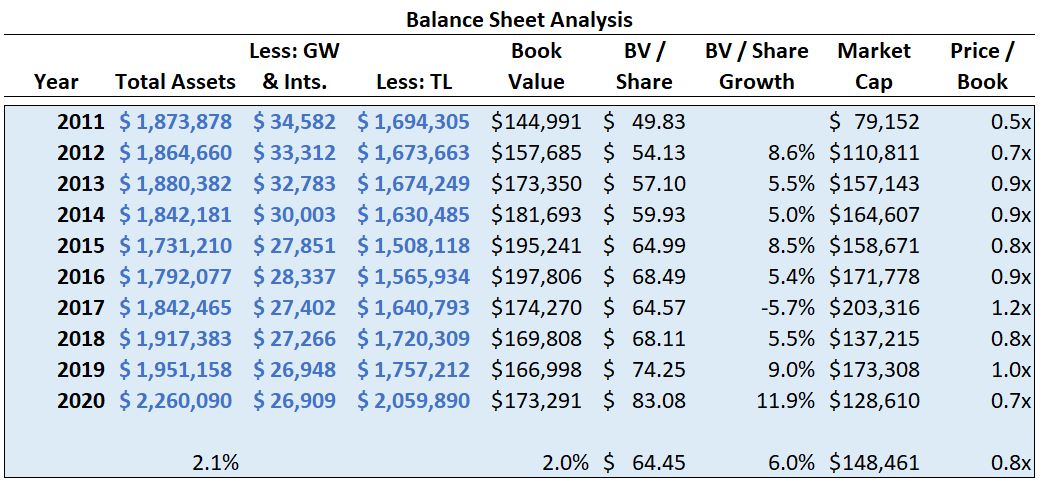
The last time I value JPM, it didn’t go as planned because DCF doesn’t work with Banks. The banking industry is different because cash is their resource and the product. Banks move money around a lot through loans, deposits, and investments. Projecting Free Cash Flow using the standard model, which includes subtracting CAPEX from the Operating Cash Flow, is very limited. So, we need to look at revenue, book values, margins, and growth rate.

Today, we will be analyzing 7 banks as follows:
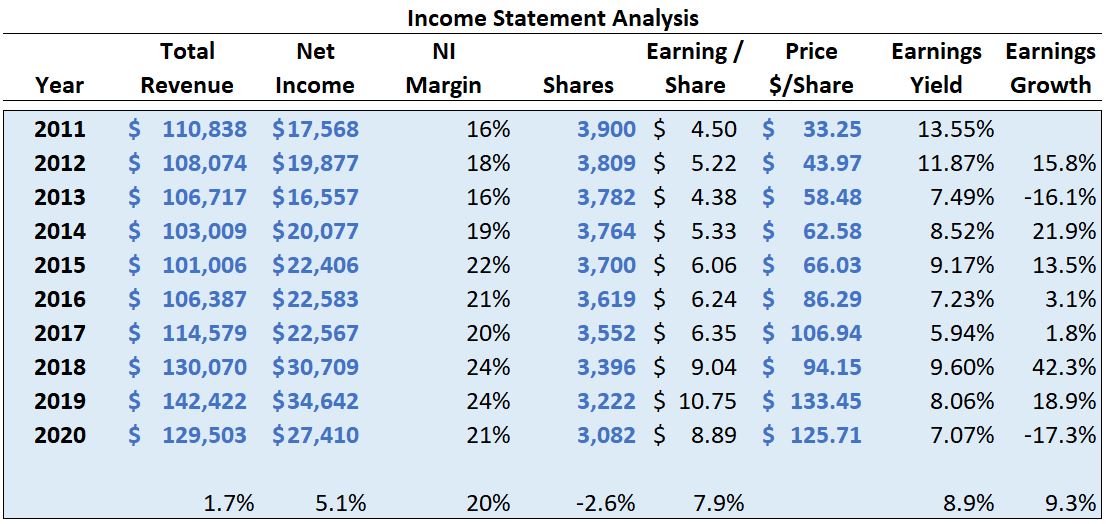
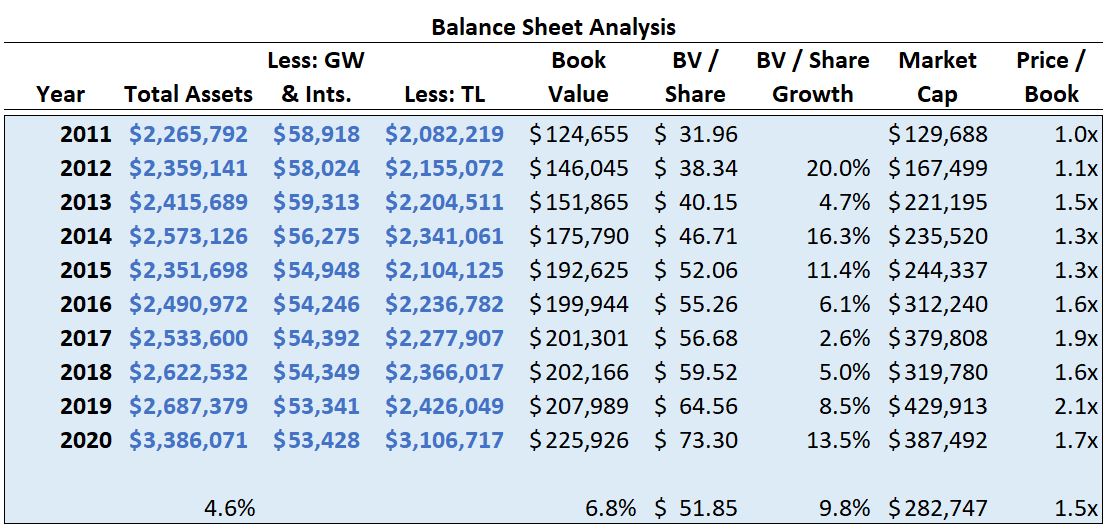
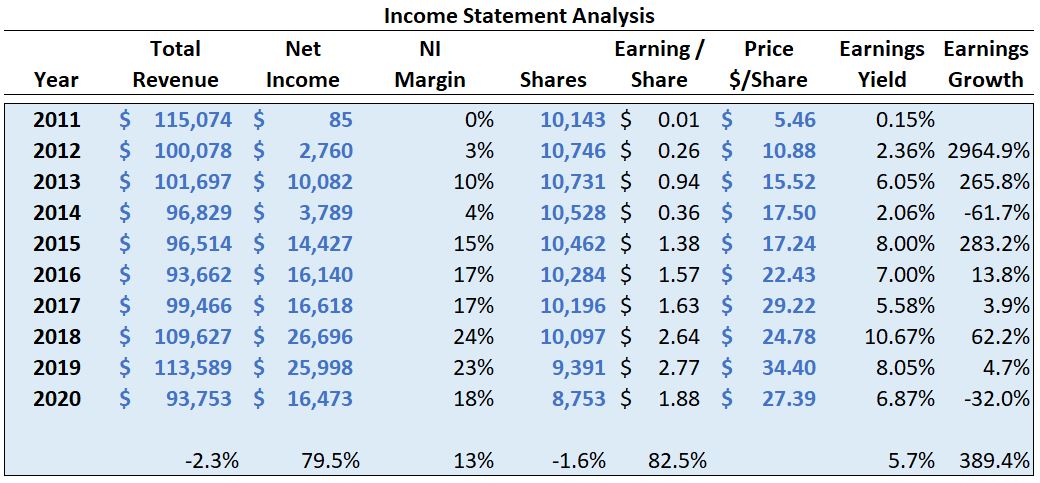
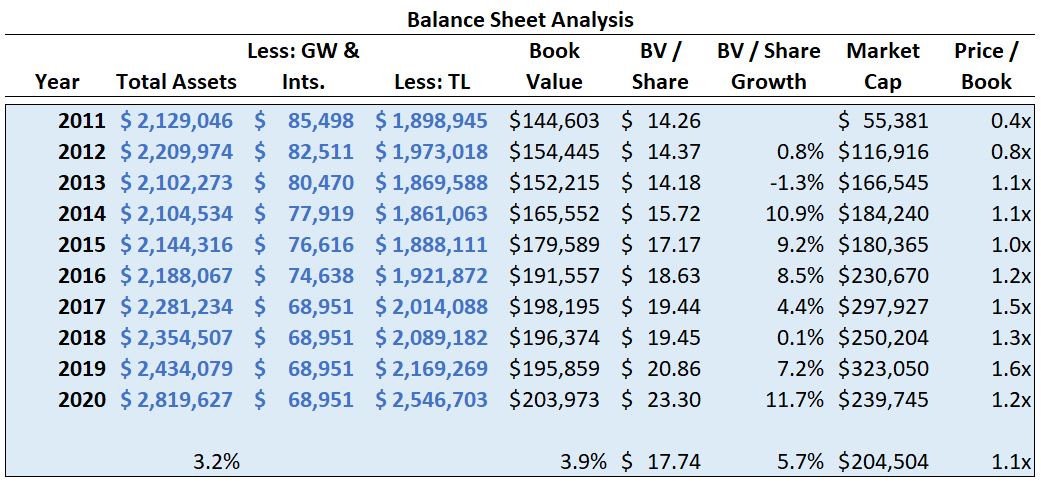
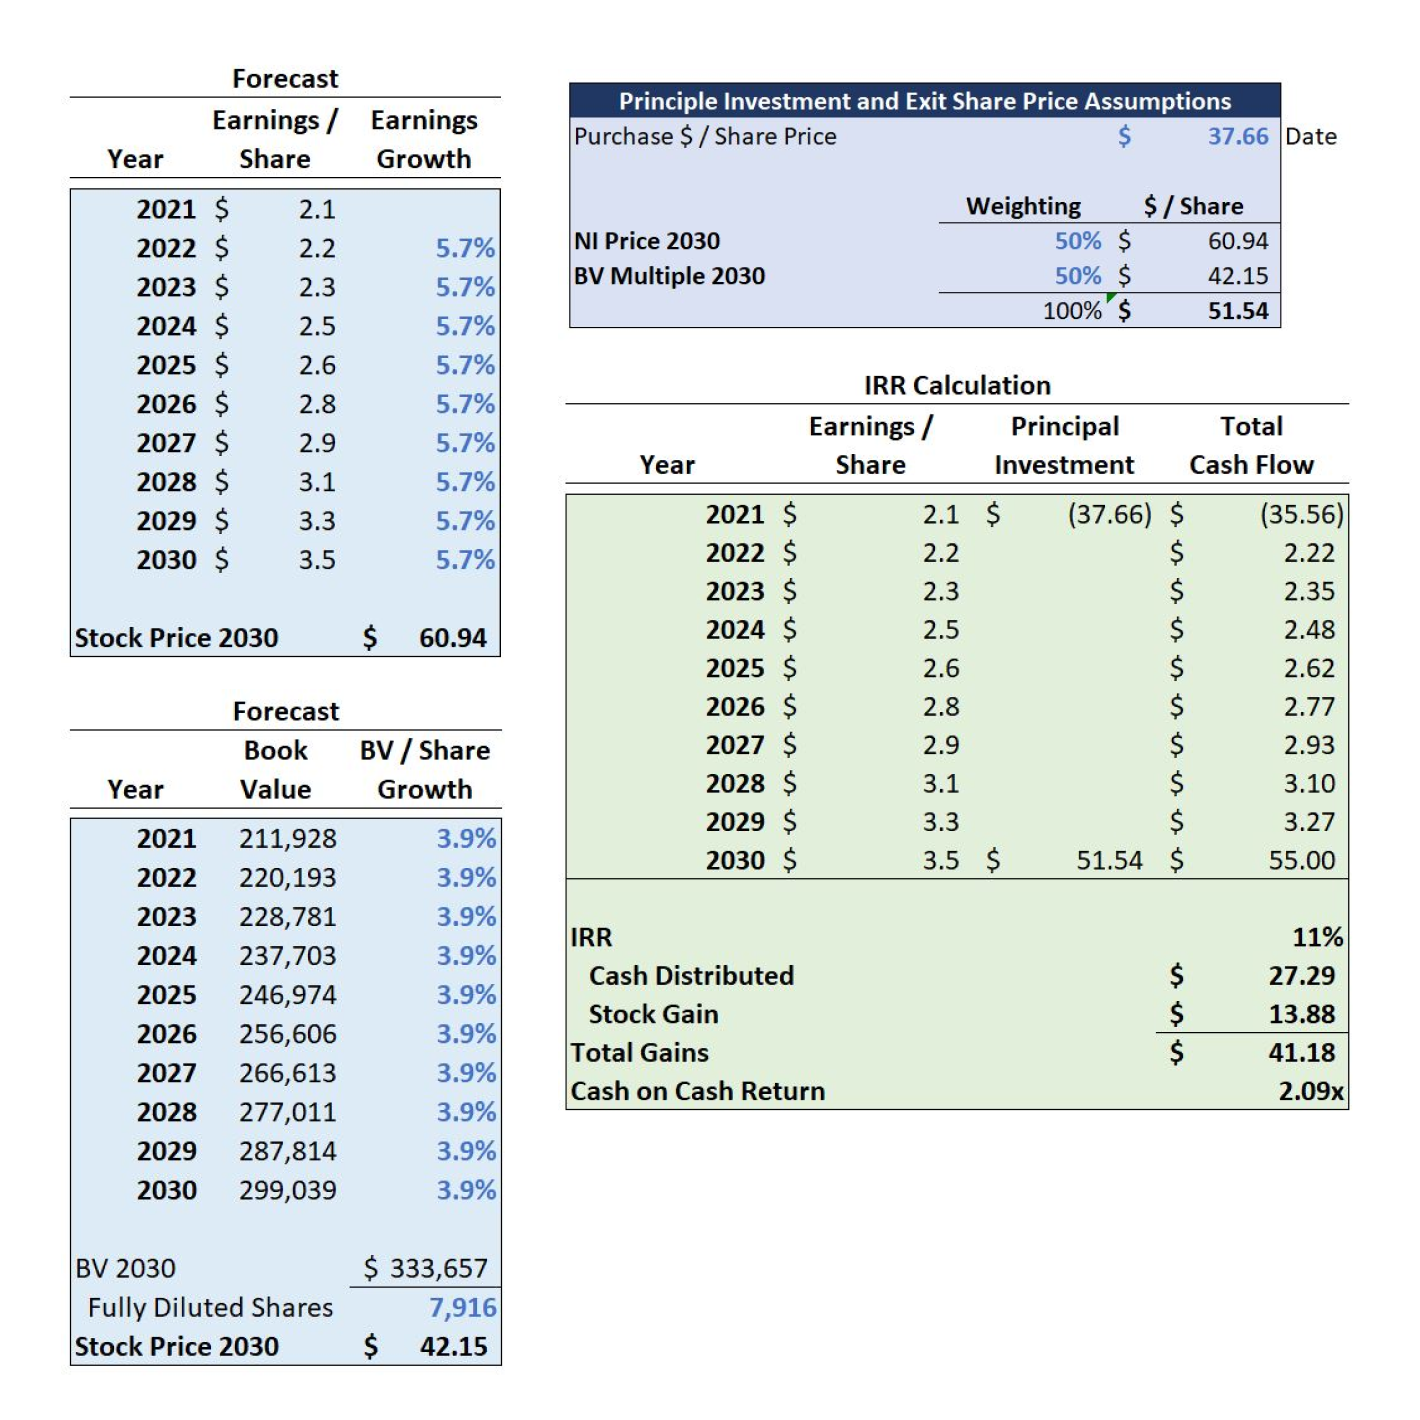
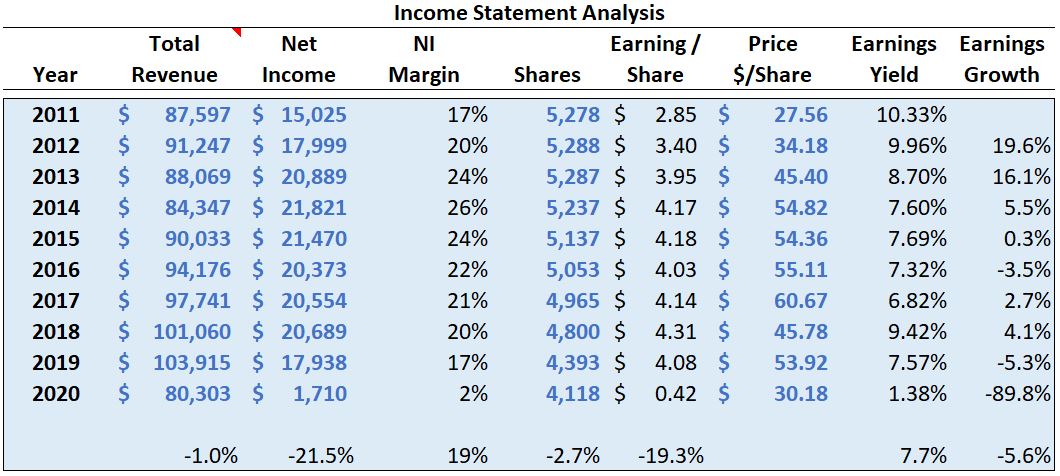
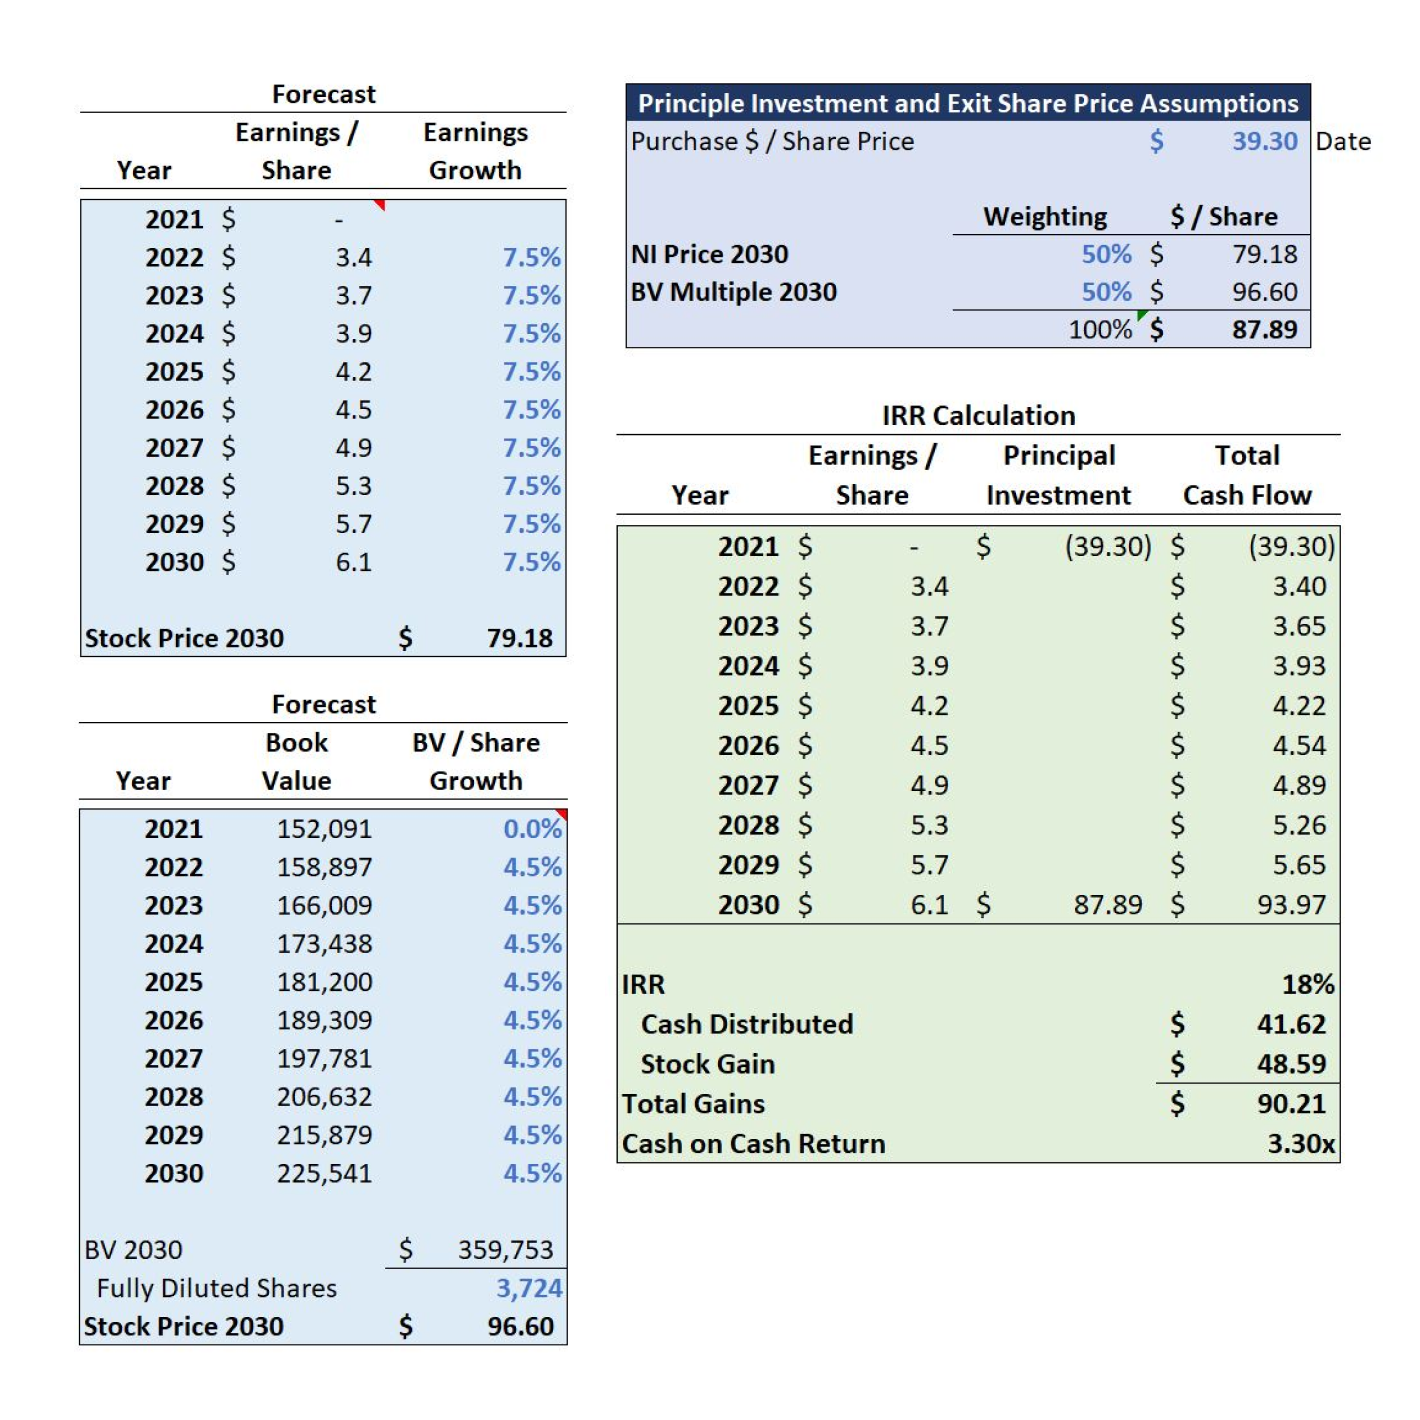
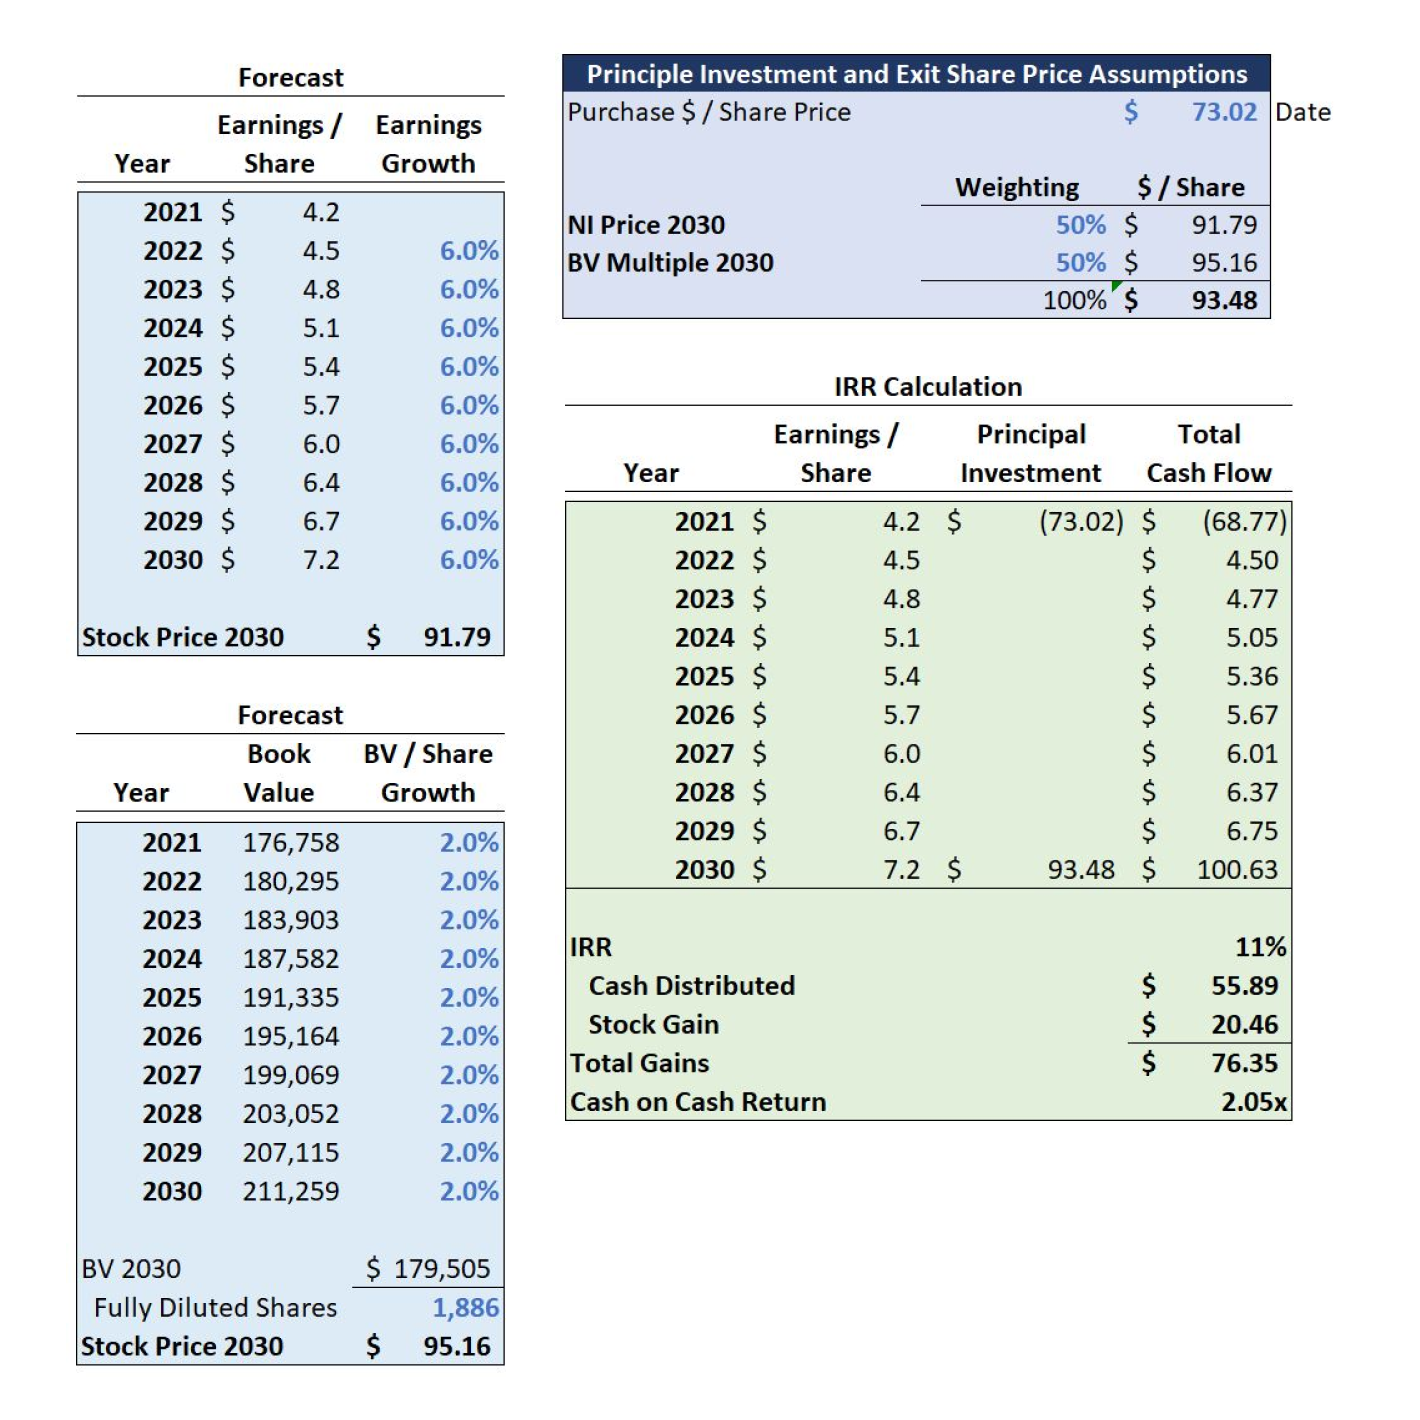
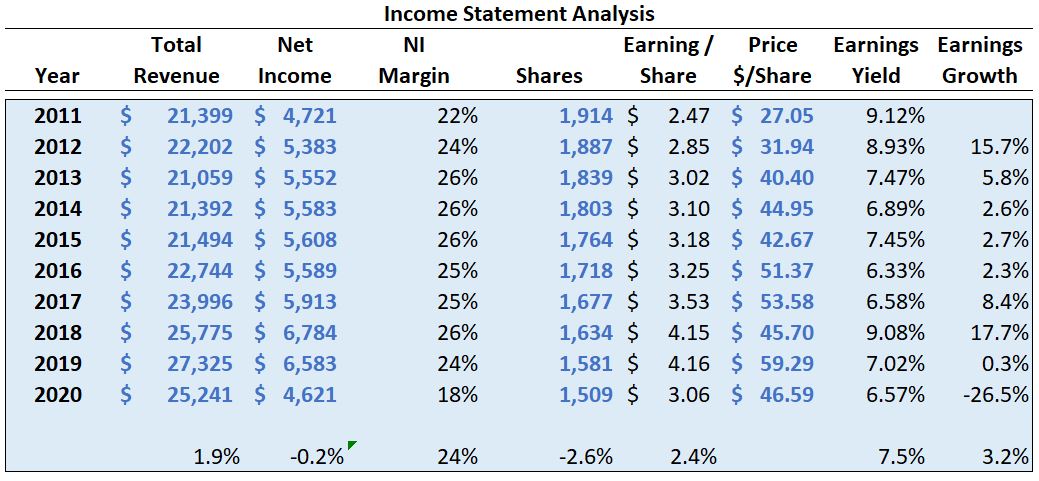
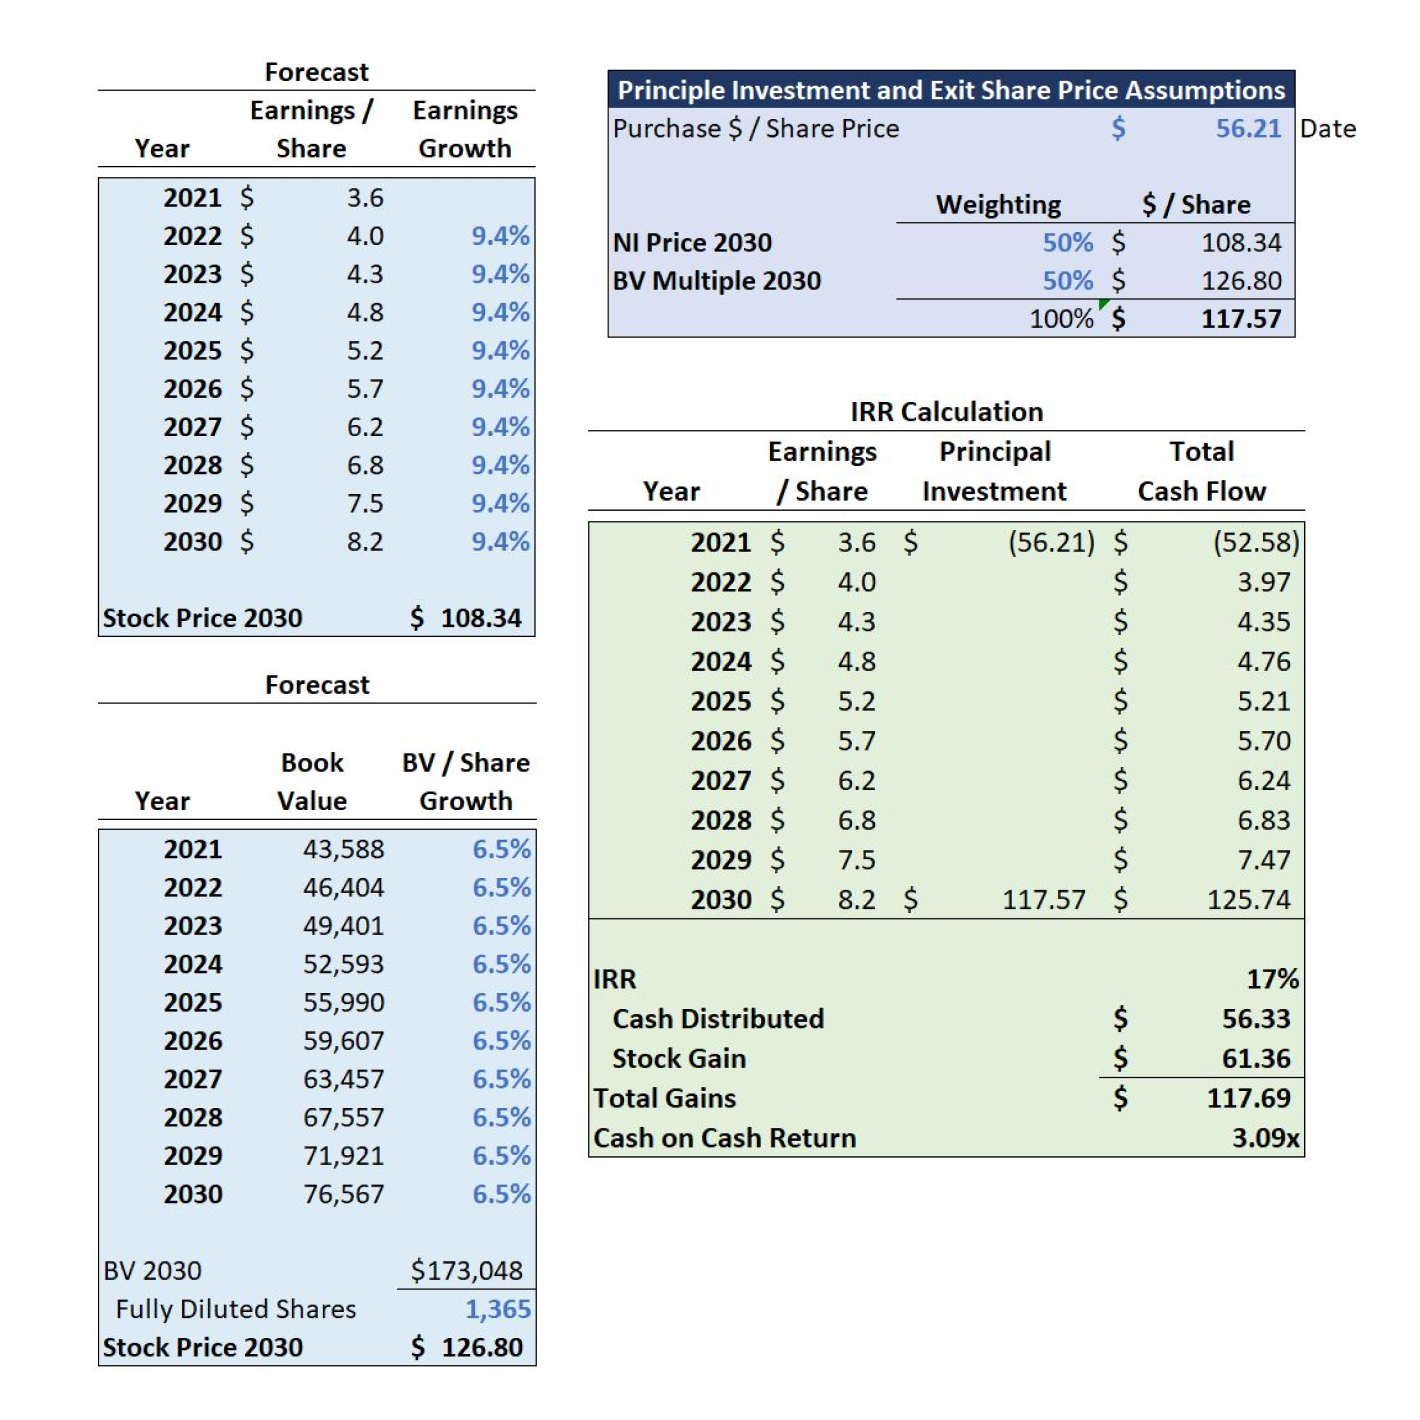
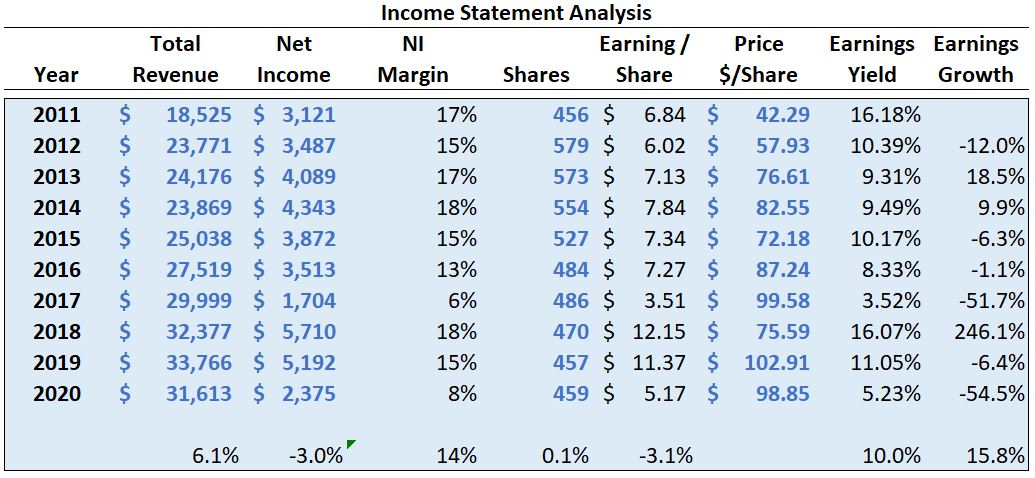
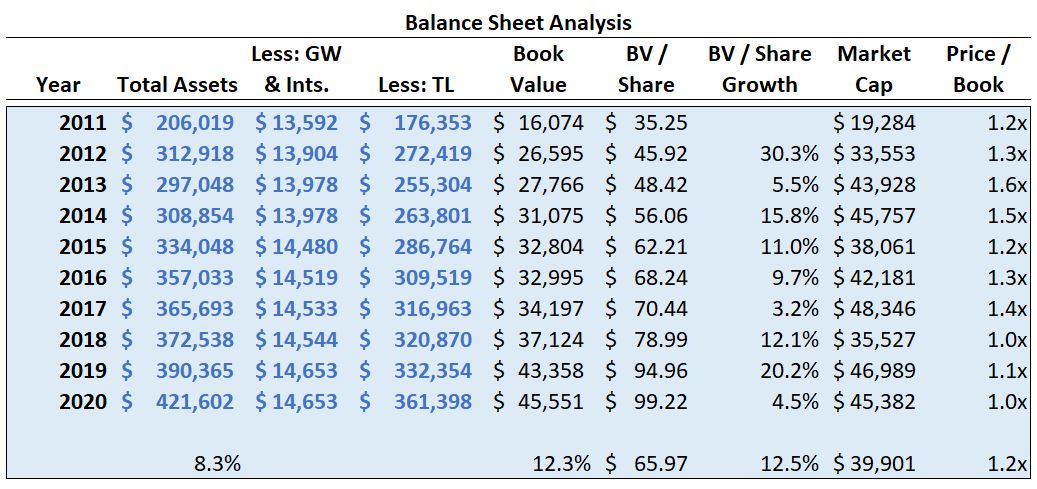
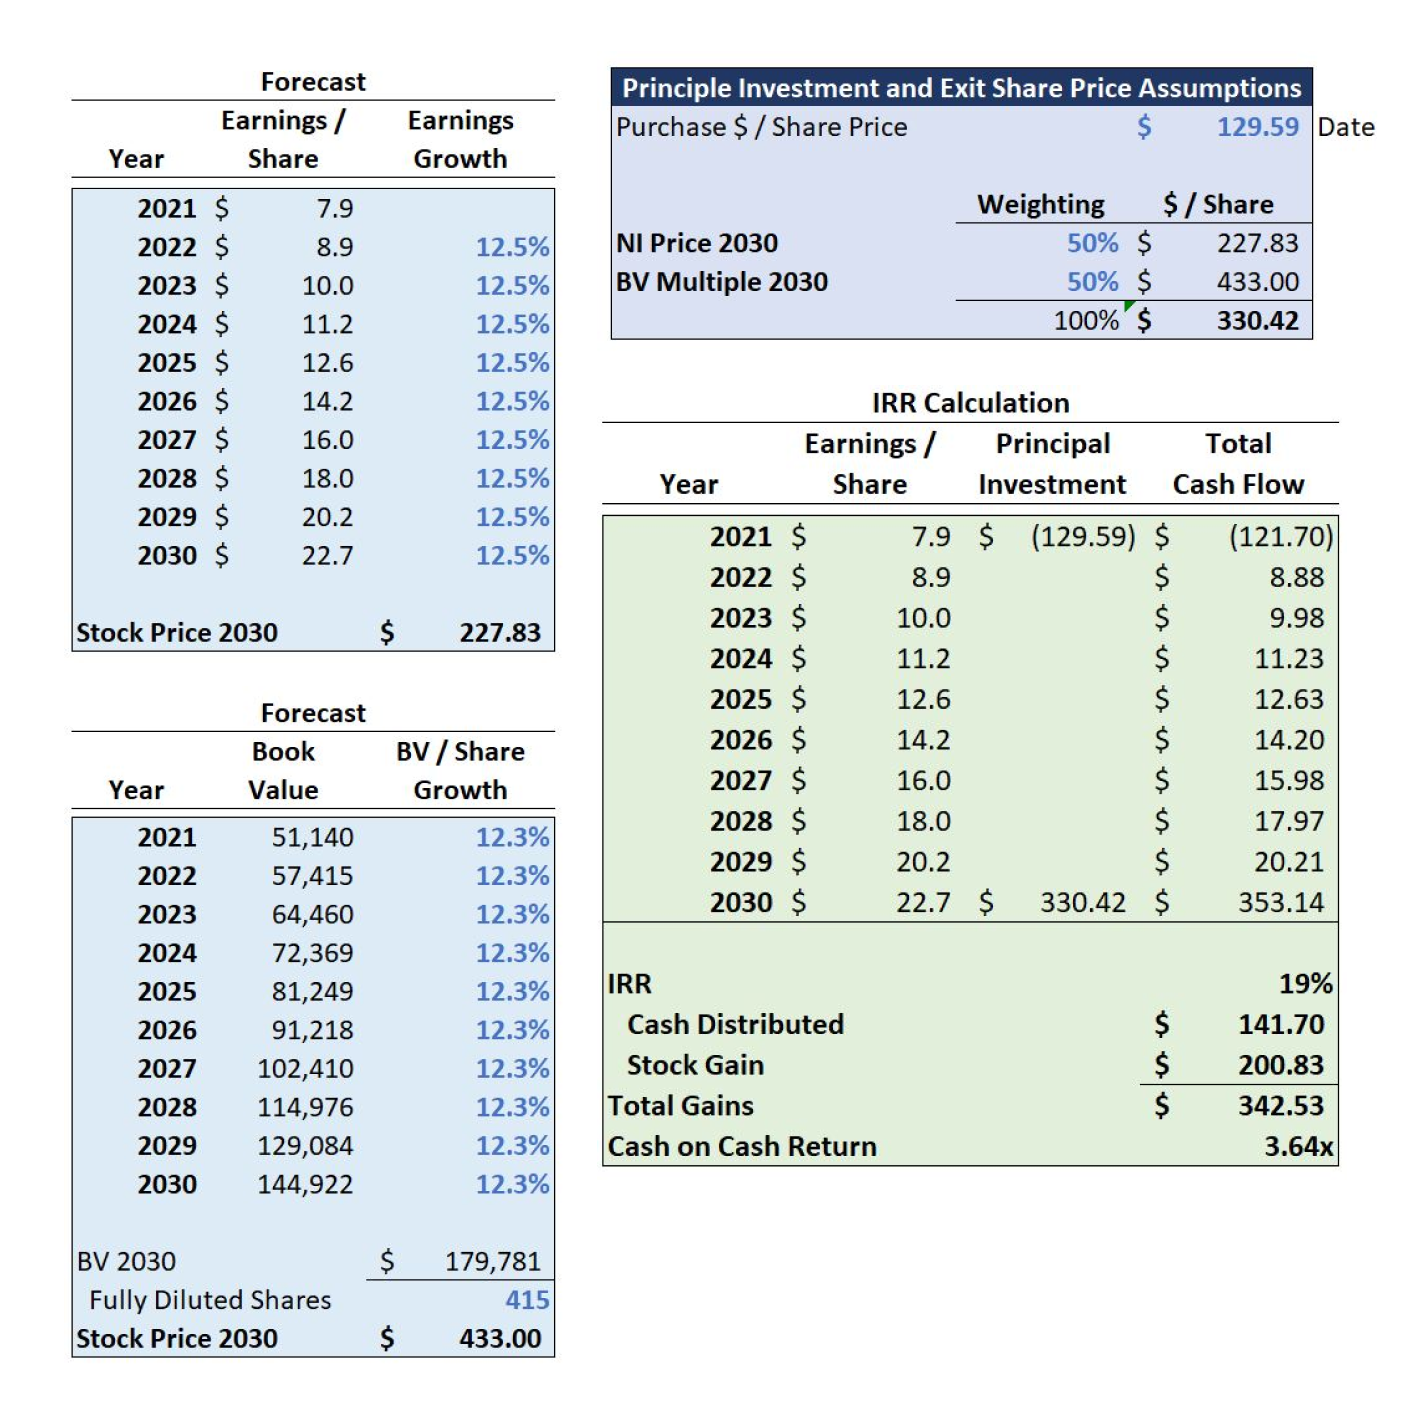
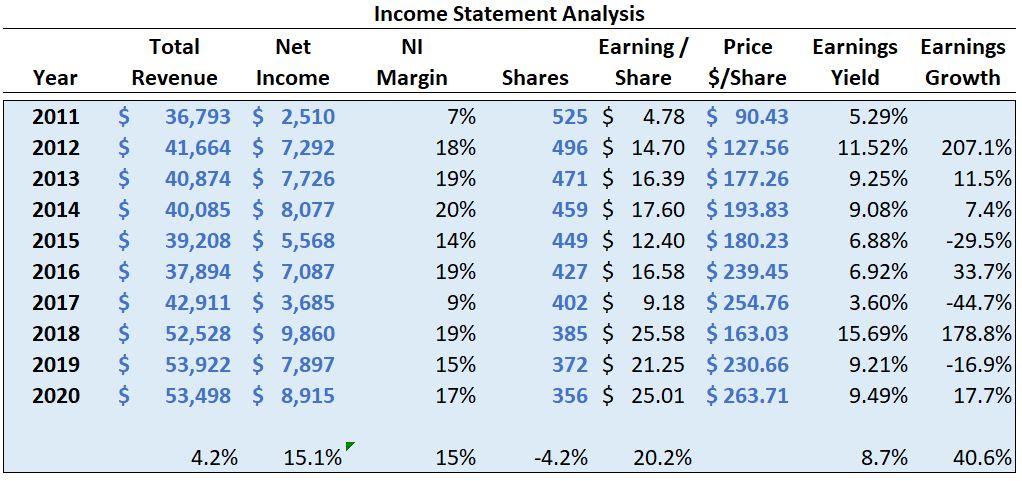
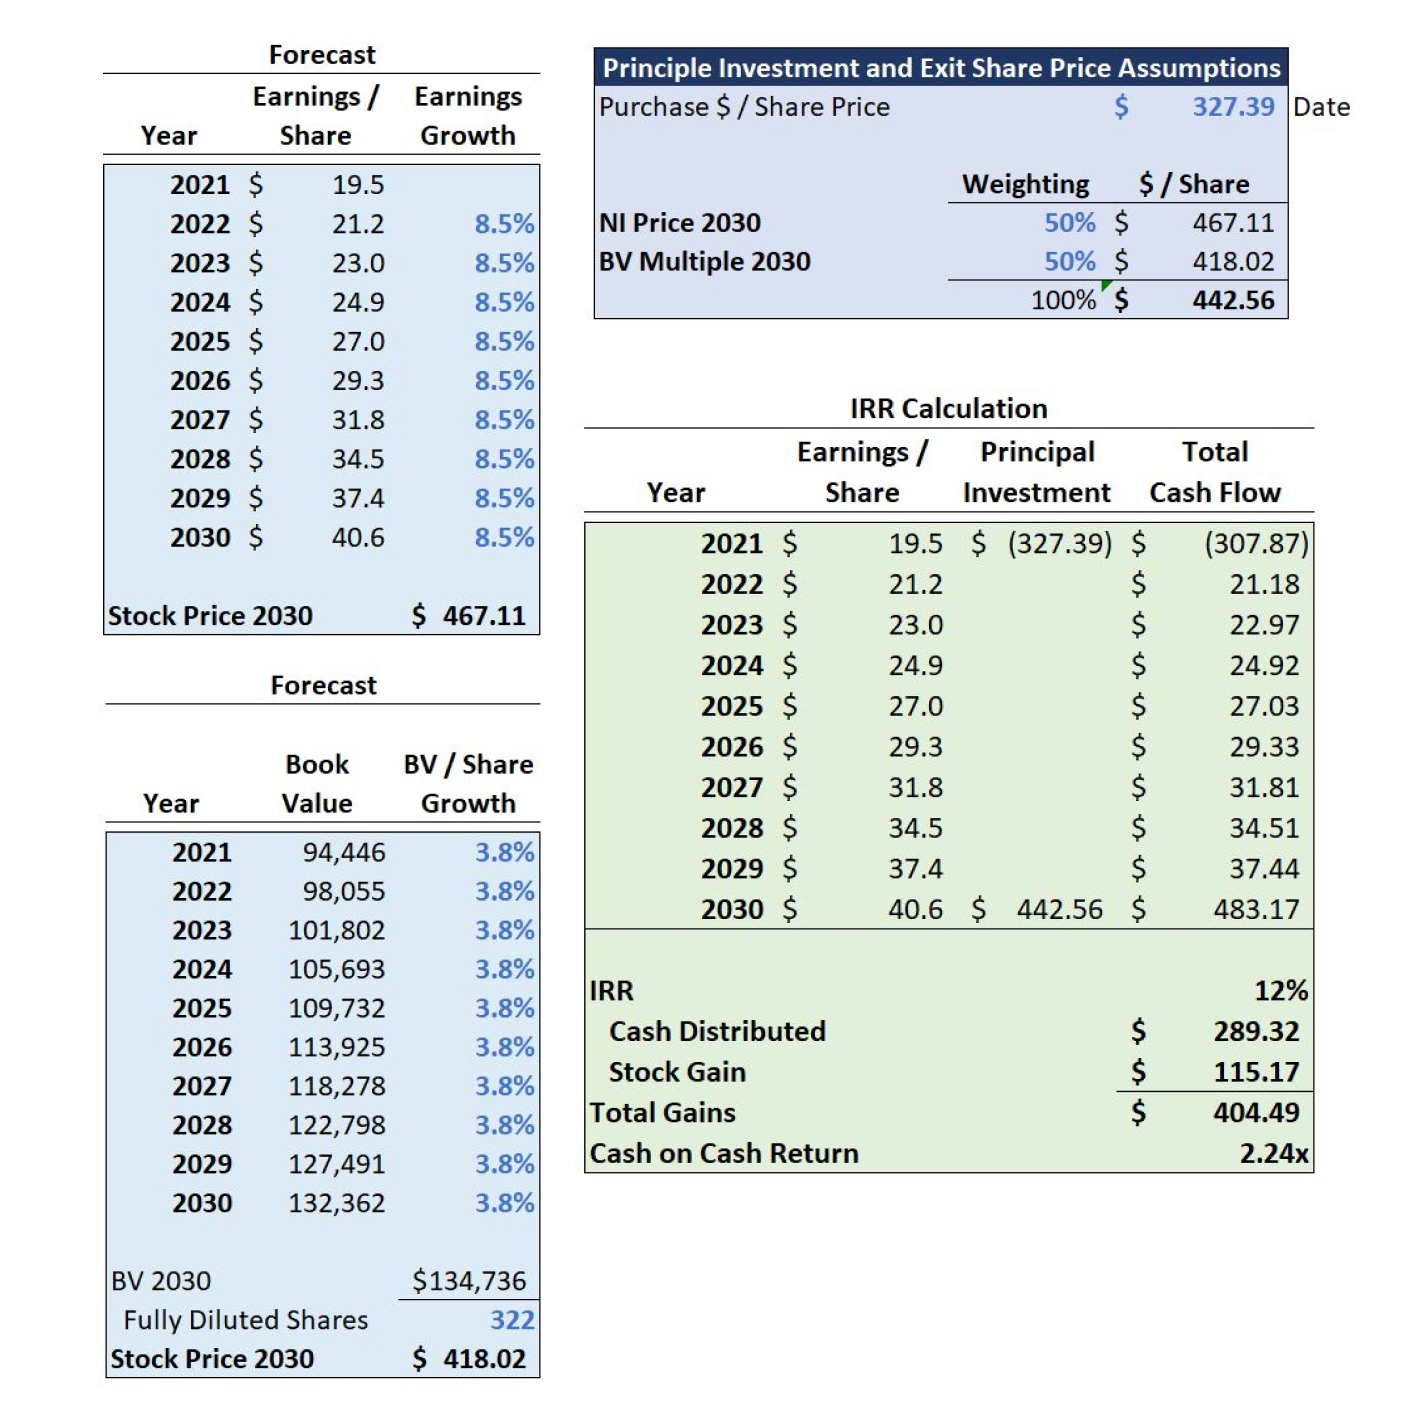
Using both the Income Statement and Balance Sheet approach, I calculated respective growth rates in book values and earnings. I forecasted the approximate intrinsic share price at the next ten-year mark using the growth rates. Using the current day share price and the predicted share price, I found the internal rate of return and the cash on cash return which I can use to make a sound investment decision.
The following spreadsheet includes valuation and analysis for all seven banks under study. Values are in millions except per share.
Download File: Individual Company Valuation Spreadsheet
JP Morgan
 |
 |
| Share Price Forecast and IRR |
|---|
 |
Bank of America
 |
 |
| Share Price Forecast and IRR |
|---|
 |
Wells Fargo
 |
 |
| Share Price Forecast and IRR |
|---|
 |
Citigroup
 |
 |
| Share Price Forecast and IRR |
|---|
 |
US Bancorp
 |
 |
| Share Price Forecast and IRR |
|---|
 |
Capital One
 |
 |
| Share Price Forecast and IRR |
|---|
 |
Goldman Sachs
 |
 |
| Share Price Forecast and IRR |
|---|
 |
Written By
Dana K Lain, Profile: LinkedIn
Date: March 28, 2021